
A Small Business Guide to Shipping Perishable Food
October 30, 2025
6 Bookkeeping Tasks to Wrap Up Your Year
November 24, 2025A Small Business Guide to Shipping Perishable Food
October 30, 20256 Bookkeeping Tasks to Wrap Up Your Year
November 24, 2025November 5, 2025
Financial Benchmarks for Direct-to-Consumer Food Businesses: Q3 2025
By Grace Debbeler, Business Consultant

Every quarter, we benchmark a select group of our direct-to-consumer food clients to provide a clear snapshot of industry performance. These benchmarks are designed to give business owners real numbers they can use to set targets, spot trends, and sharpen strategy.
Click here to download our latest quarterly industry report.
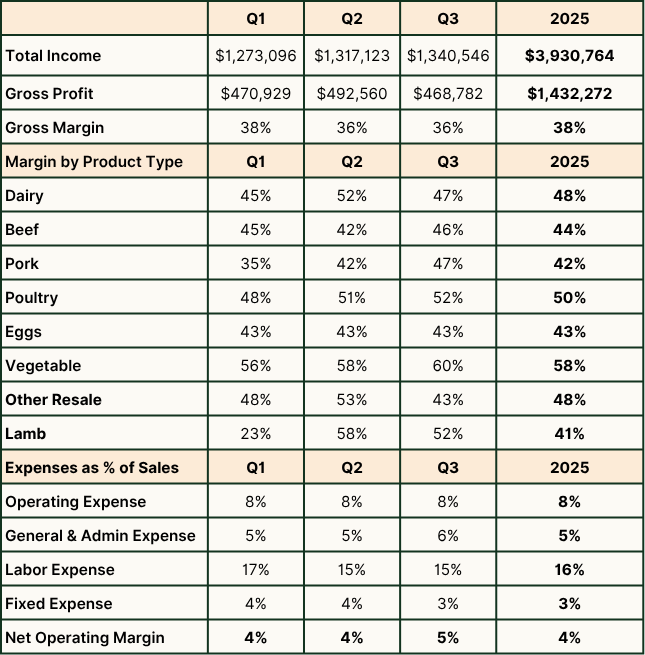
By the third quarter of 2025, our 10 direct-to-consumer benchmarks are averaging nearly $1.3M per quarter, totaling $3.9M year-to-date (YTD). Gross margins have edged downward, continuing the trend from 2024, as businesses face sustained profitability pressures. Overall, top-line sales are up 23% year-over-year for our benchmark clients, signaling ongoing demand despite cost headwinds.
Product Level Margins
- Dairy: Dipped to 48%, down from 52% in Q2, which is consistent with seasonal production patterns and what we saw in 2024.
- Poultry: Looking solid as we head into turkey season, as some of our benchmarks are taking pre-orders.
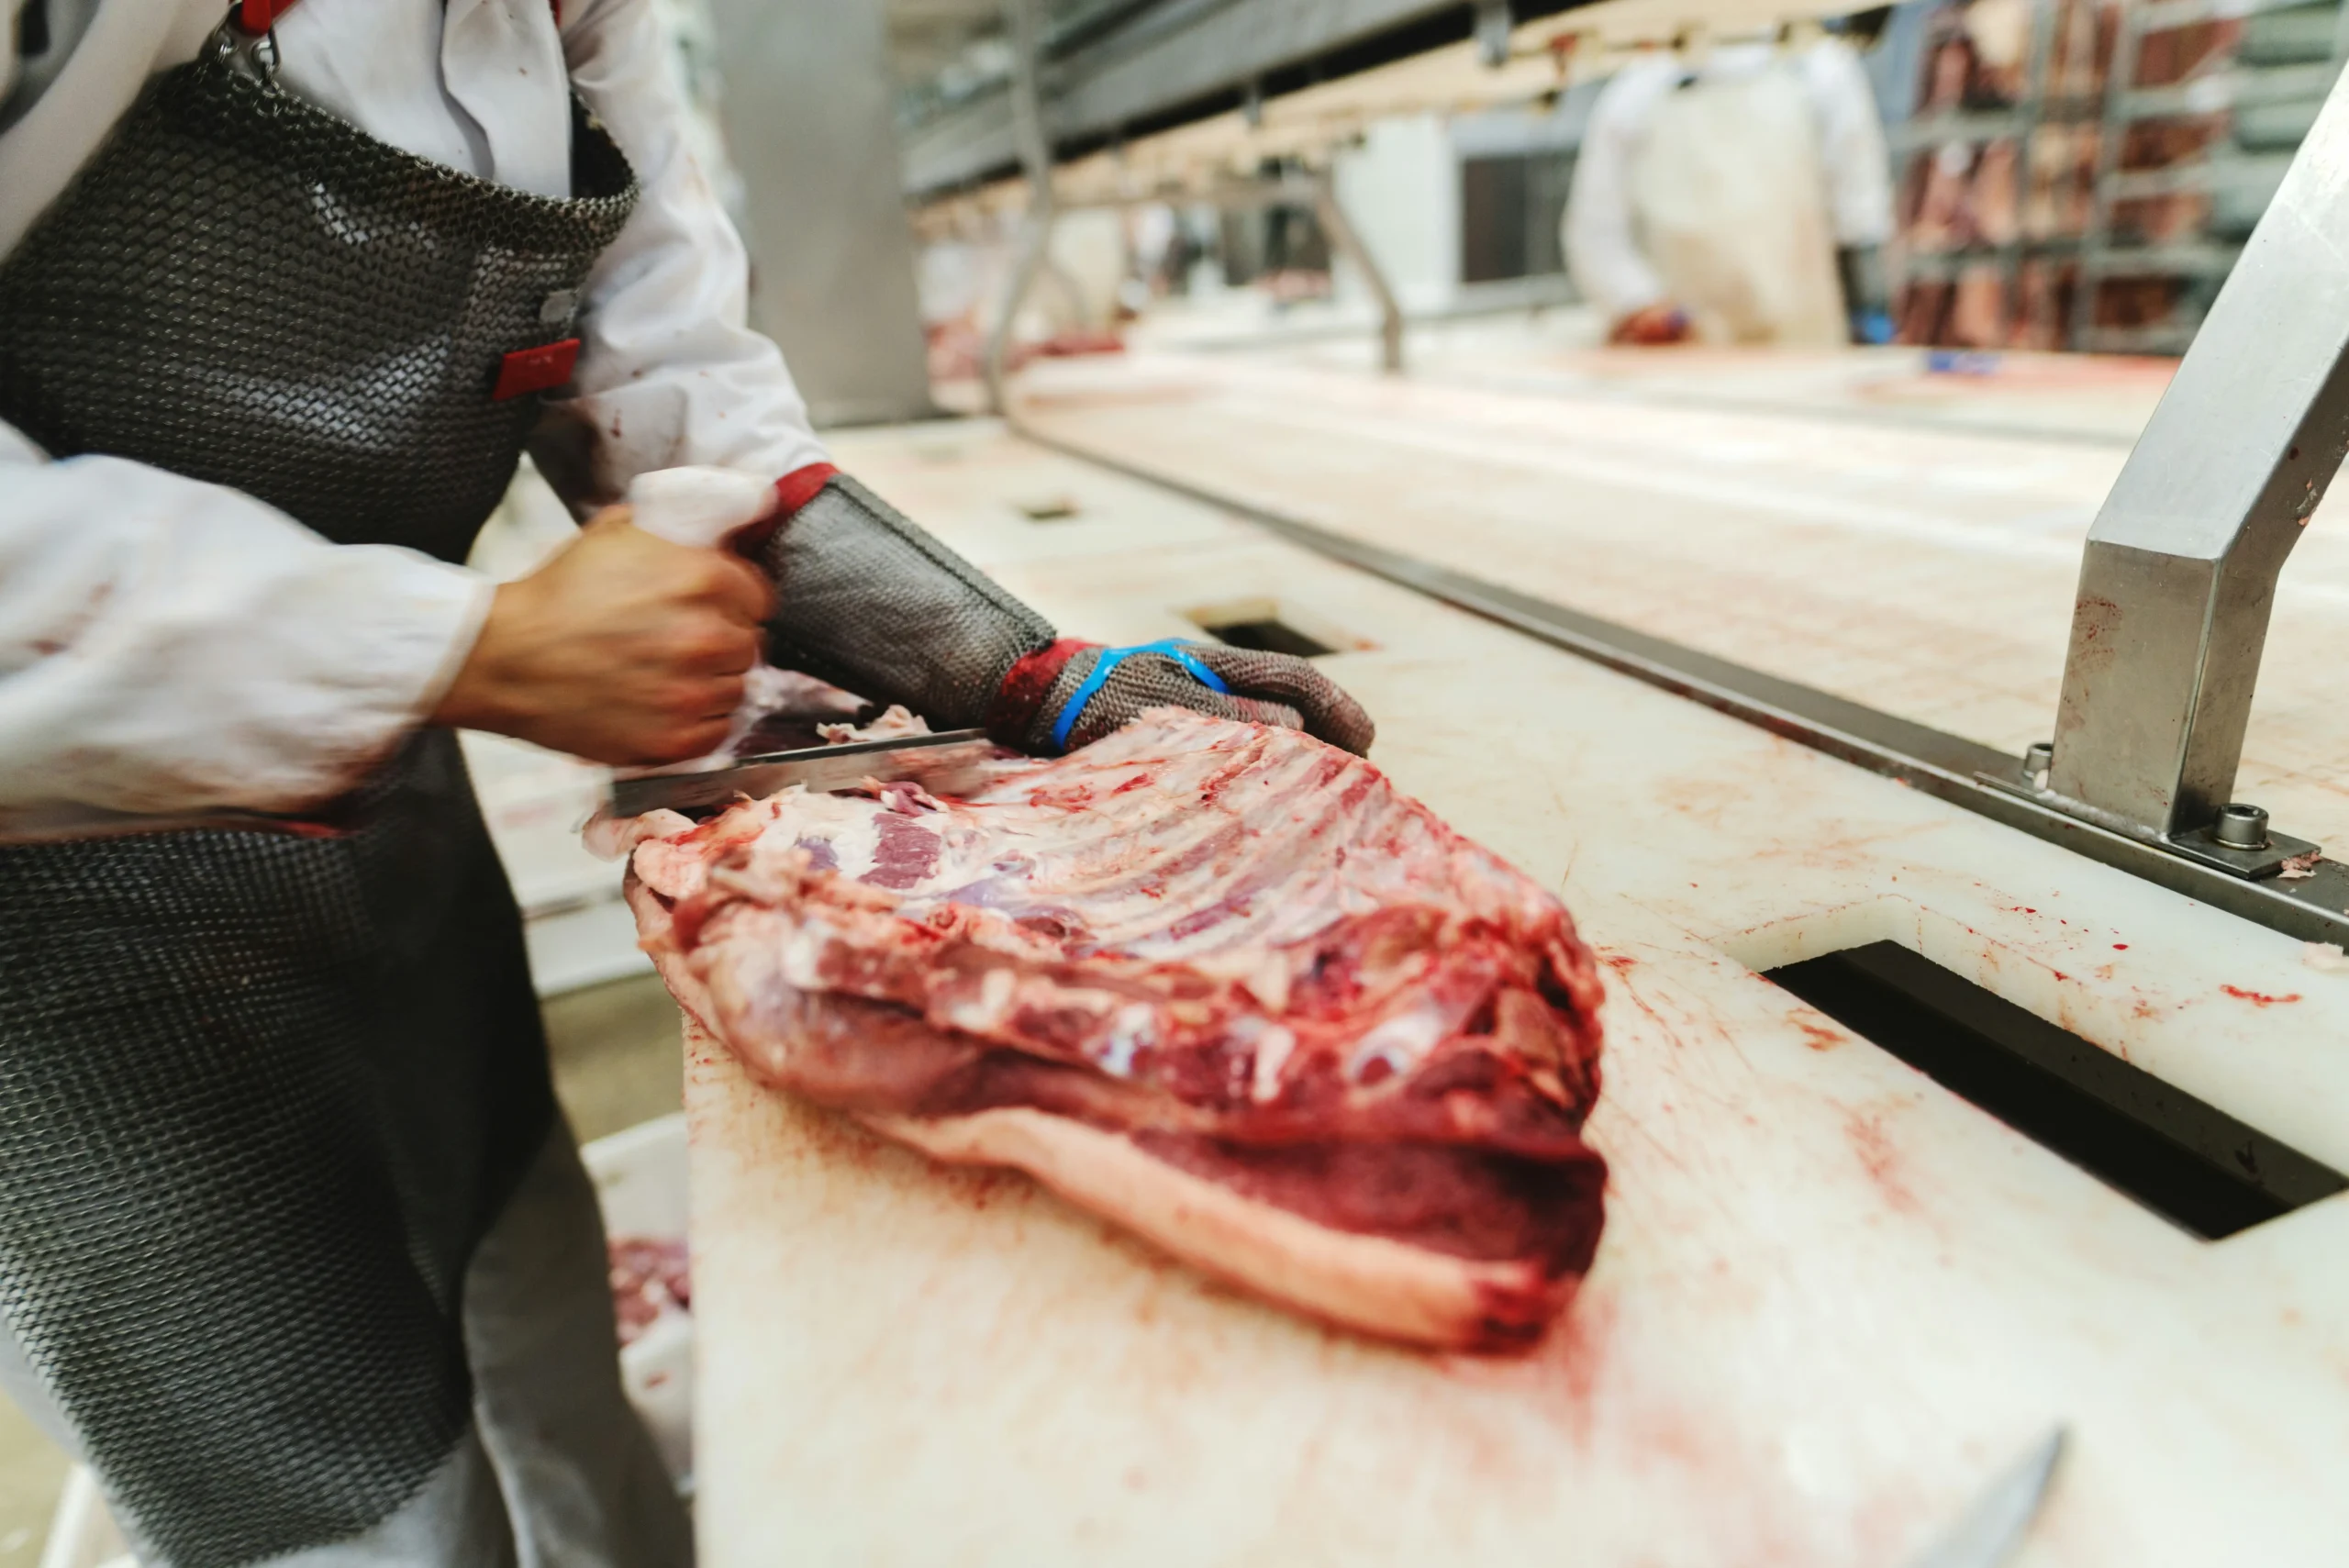
- Beef: Holding steady at 44% YTD, right on for where we were at this point last year.
- Eggs: Shoutout for a solid 43% margin the past three quarters and running.
Be a savvy business owner.
Get tips on accounting, finance, marketing, and more, tailored for farms and food businesses—free.
"*" indicates required fields

Expenses & Net Margins
- Operating Expenses: Flat at 8%.
- General & Administrative: Steady at 5%.
- Labor Costs: Holding at 16%, down from 19% in 2024.
- Fixed Expenses: Stable at 4%.
- Net Operating Margins: Steady at 4% YTD.
Strategic focus for the next quarter:
- Stay sharp in Q4! With seasonal sales volumes rising, now’s the time to drive growth while keeping a close eye on profitability.
- Plan for beef margin pressure. This is expected to persist through 2026. Adjust forecasts and targets accordingly.
- Align inventory and pricing strategies. Prepare for quick turnover by making sure you’re stocked and priced for Q4 demand.
- Review your costing and pricing. Confirm your current structure reflects true costs and supports your margin goals.
Budgets vs Actuals
We’ve seen several businesses miss their budgeted sales targets this quarter. Sales are up year over year but tracking below forecast. This is a good time to revisit Q4 projections to keep marketing, staffing, and purchasing aligned.
About This Data
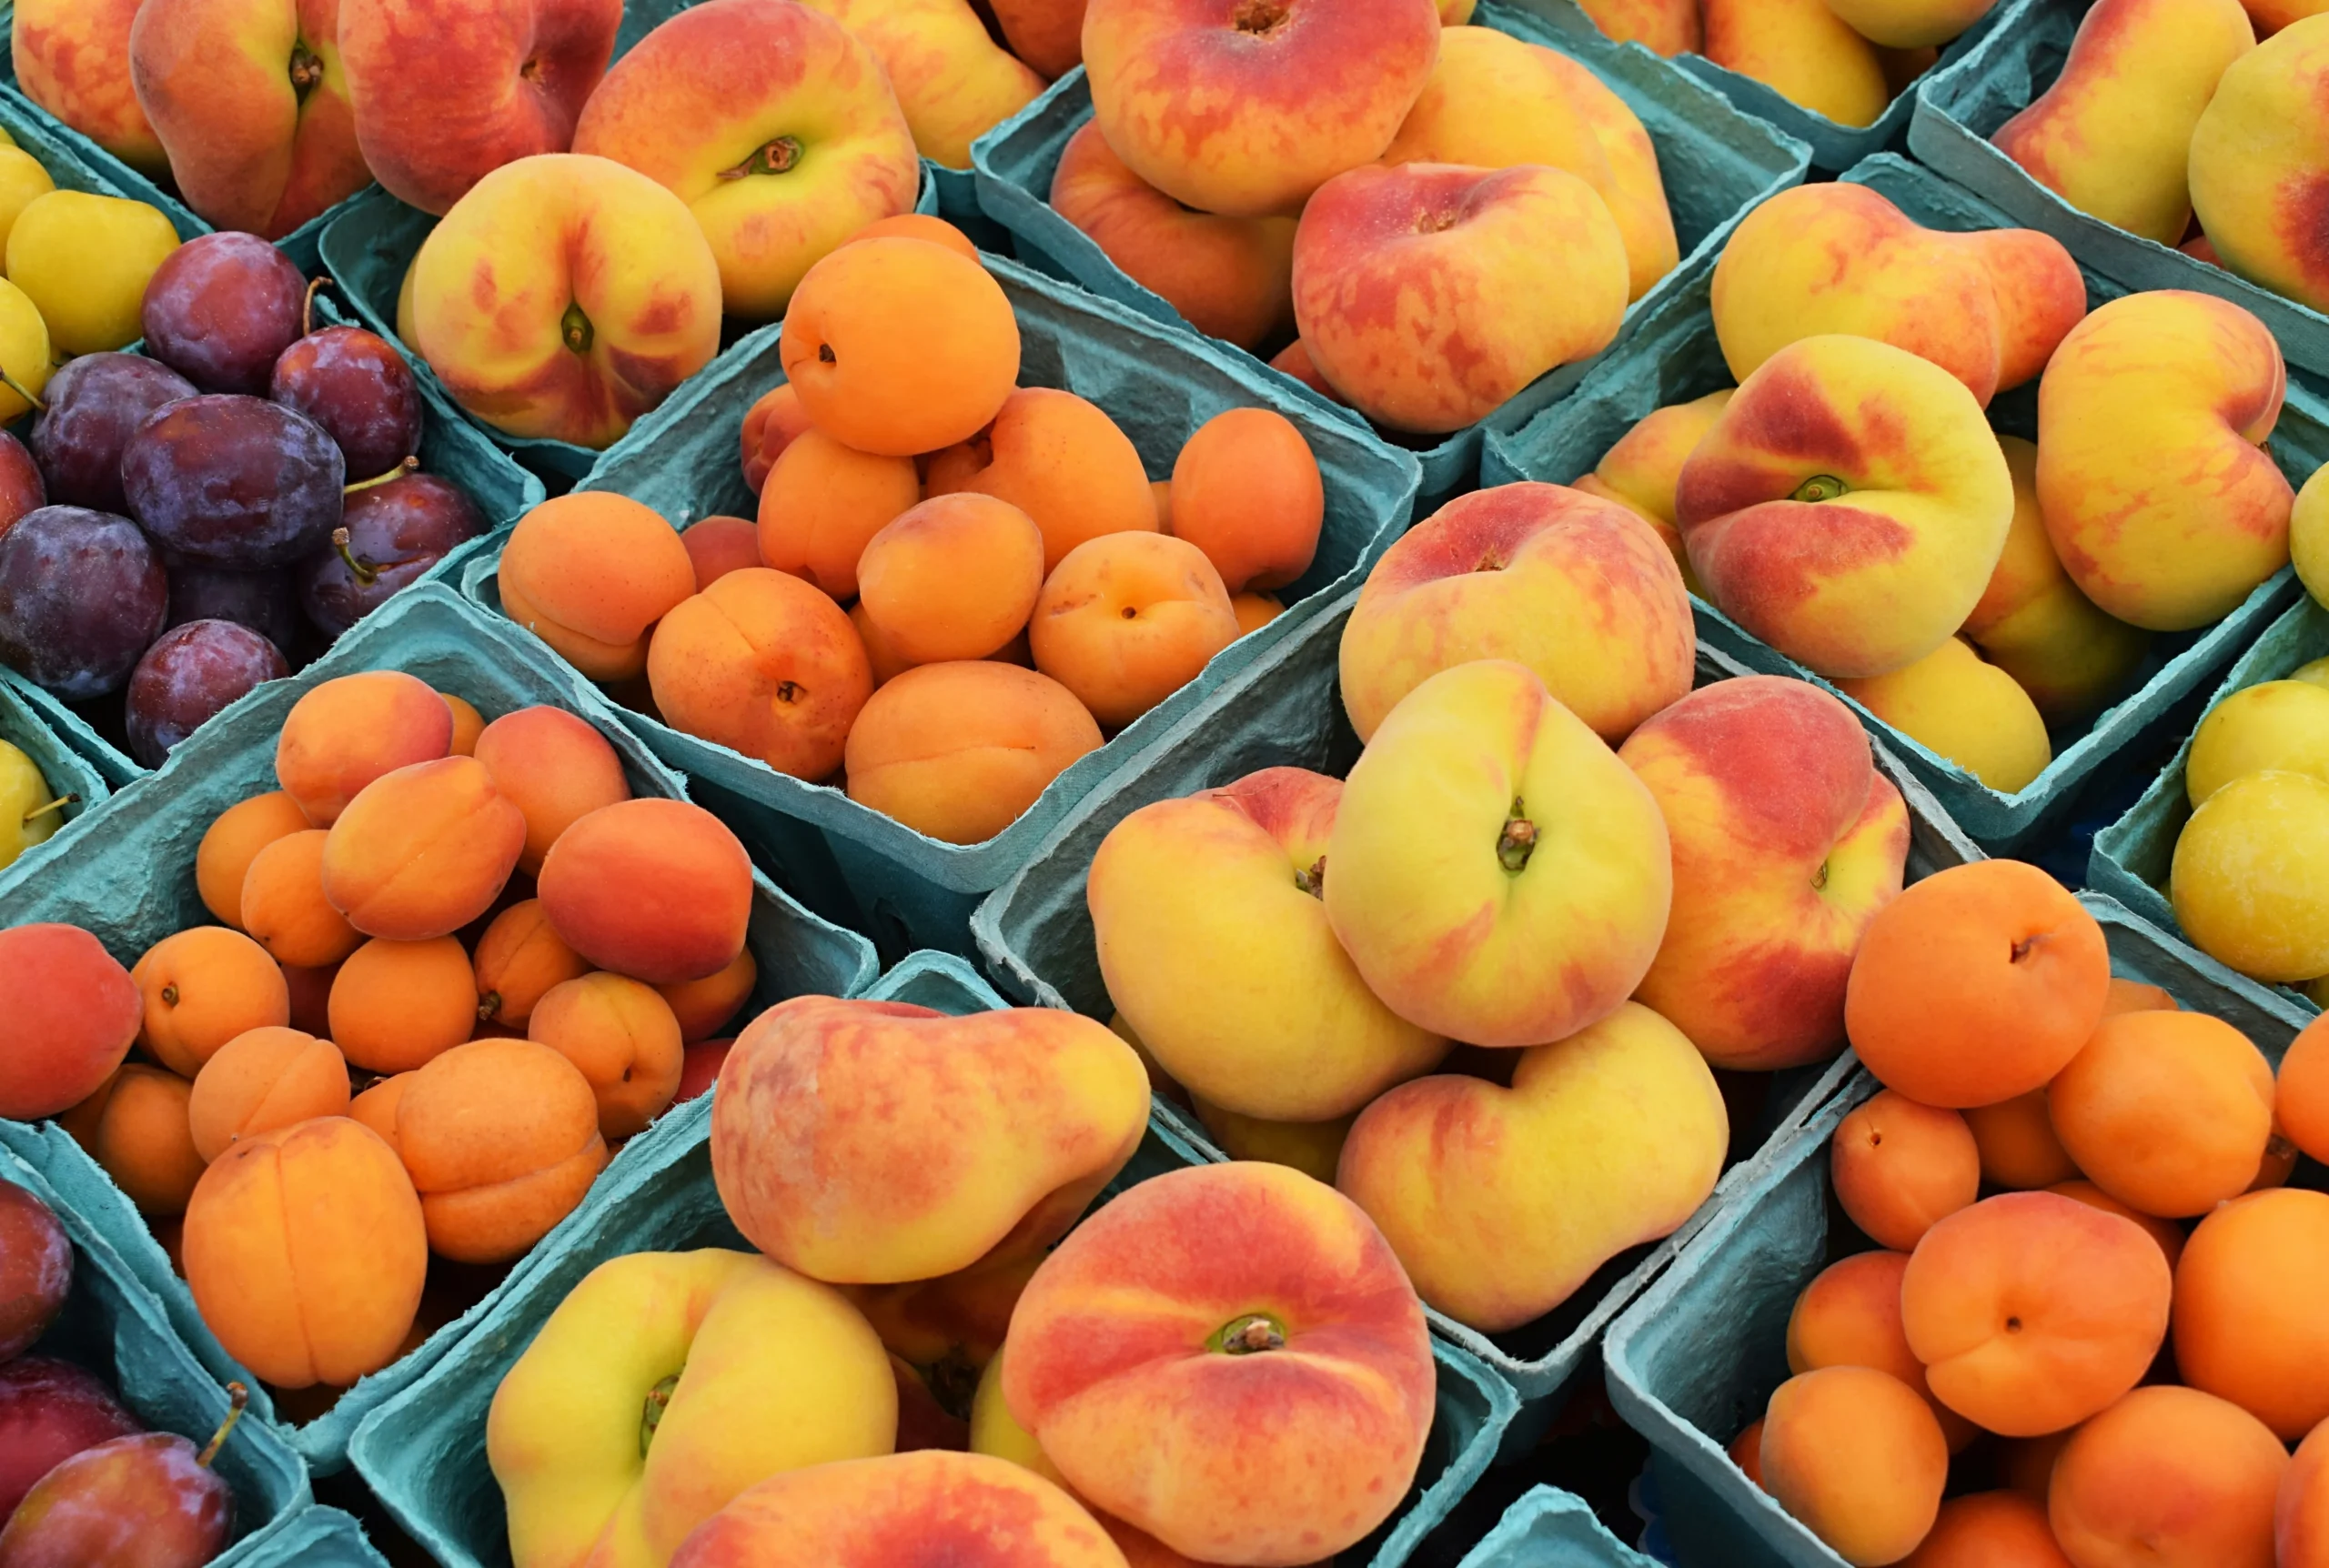
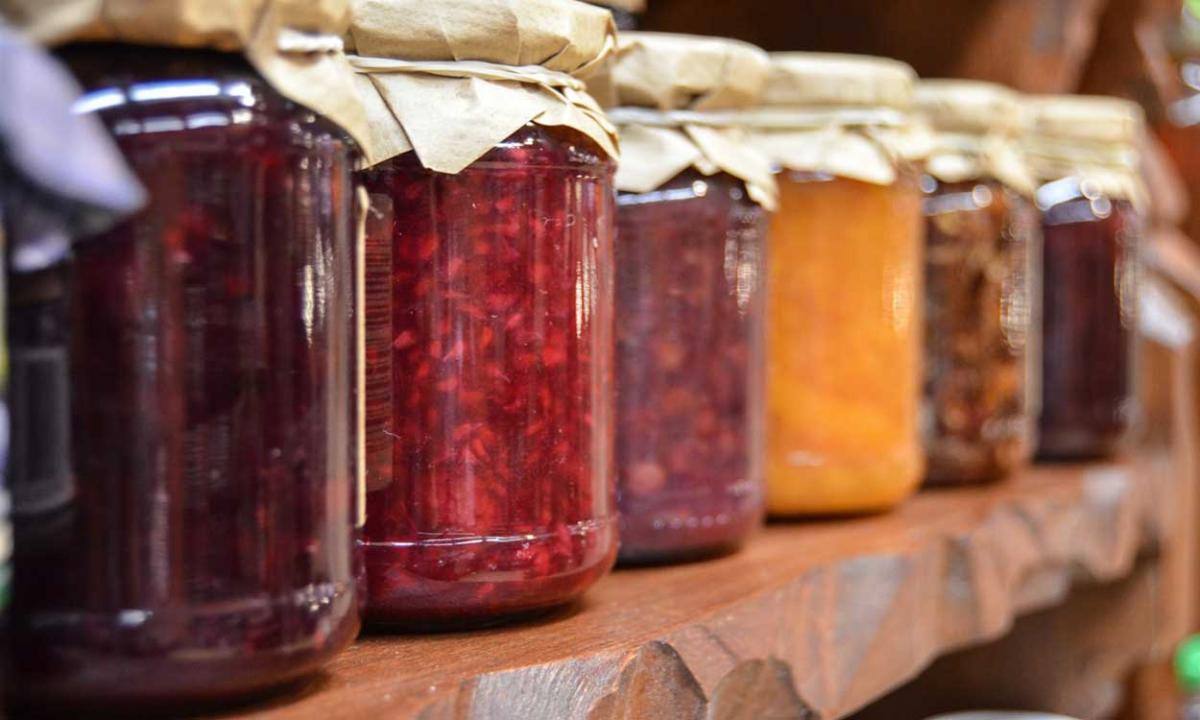
This data comes from ten clients selling direct-to-consumer who provide local, organic, or regenerative food through drop points and shipments. Each company offers a mix of items—meat, dairy, produce, seafood, and other groceries. While some also run production farms, these benchmarks focus only on the part of the business that sells directly to customers.
The goal is to provide financial benchmarks to help other direct-to-consumer food businesses plan, forecast, and improve performance. Because we set up the chart of accounts for all eight companies and used consistent definitions for key metrics like gross margin and COGS, the data is directly comparable.
